Pandas Profiling vs Kortical - ML Data Prep
An Exploratory Data Analysis Tool Comparison


Table of contents
Introduction
Assisted Exploratory Data Analysis (EDA) is gaining popularity with the data science community. As the Kaggle CTO tweeted data-science is 90% understanding your data yet most tools are focused on automating the coding rather than the data analysis. This article breaks down two of the best tools Pandas Profiling and Kortical - ML Data Prep.
Clearly working for Kortical, I am very much team Kortical but I have attempted to make as fair a comparison as possible. While I'll start with a high level comparison chart, every point I make is fully self evident in the detailed usage comparison below said chart.
When pointing out timings, features, etc. I’ve based it on a comparison of that famous Kaggle dataset House prices: Advanced Regression Techniques. This was chosen as it is one of the starter datasets for Kaggle and it is slightly larger at 461KB. Most criticism levelled at Pandas Profiling is about how useful it is for large datasets but at 461KB it is tiny compared to almost any real life dataset we’ve seen.
For the chart below I’ve highlighted any obvious winner for a given feature in green.
| Pandas Profiling | Kortical - ML Data Prep | |
|---|---|---|
| Price |  Free (Open Source) Free (Open Source) |
Free and Paid Versions |
| Setup | Pip package install (local) | Web sign-up (Saas) |
| Time to first insights | Discounting the time to write the code. 8 mins 32 seconds to execute | Uploading the data took 6 seconds. The insights took 2 seconds to appear |
| Data Overview | Good but missing text and date as column types | Supports all column types |
| Per column statistics | Detailed stats of all columns but represents dates and text as categorical, which is not a good way to derive insight from the data | Detailed stats for all column types. Kortical also plots variables against the target, which is hugely valuable for understanding machine learning impact |
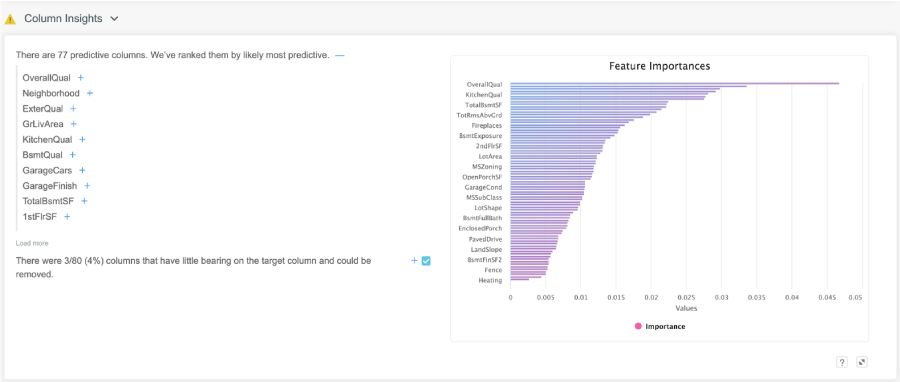
| Feature Importances | N/A | Uses ensemble of hundreds of machine learning models to create model invariant feature importances |
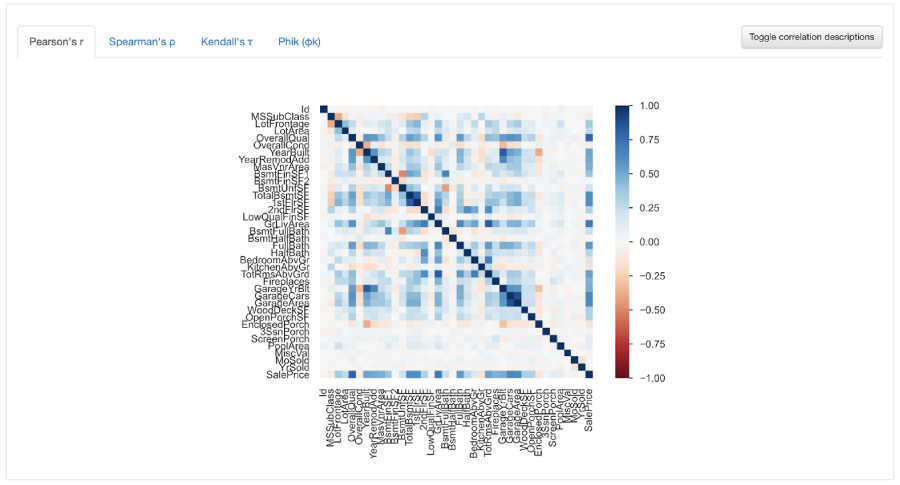
| Correlations | Supports Pearson's r Spearman's ρ Kendall's τ Phik (φk) |
Correlations do not equate to feature importances and we believe that feature importances are far more useful for understanding data for ML |
| High level insights | It has a warnings tab but this is mainly filled with insights like “BsmtQual has 37 (2.5%) missing values” which are not very useful | Kortical offers much deeper actionable insights like “Depending on the business case you might want to consider converting this regression problem into a classification problem if you're really interested in a boundary condition, eg - SalePrice > 100, as this often leads to model performance improvement.” |
| Column prioritisation for large data | The lack of this feature is what makes this tool so hard to use for large data, as you have to scroll endlessly through similar looking fields | Kortical orders the columns by most predictive, so it’s very easy to pull out key insights quickly |
| Remove redundant columns | N/A | This is a very complex feature to offer in a generic manner, given the complexity of determining utility for machine learning but is hugely useful for reducing the number of columns you have to explore and speeding up model training times |
| Target Insights | N/A | Informs you of the problem type, possible evaluation metrics you can choose and why. How the problem could be recast among many more insights. |
| Initial Predictions | N/A | If you’ve ever started a project only to find out much later that you don’t have the data to predict some classes, you’ll know how valuable this insight is to have up front |
| Data Completeness | Kortical has a very similar primary diagram but key differences are that it zooms and pans for dealing with large data. It is also colour coded to highlight data issues. On top of this Kortical provides plain English insights about the completeness of your data and offers a chance to deep dive into highlighted columns. |
|
| Column Interactions | With Kortical you can only see interactions with the target column for now but it supports the full range of types and for text doesn’t just plot the most frequent words but the most informative | |
| Automatically apply recommendations | N/A | When Kortical advises to drop redundant columns or leaky variables or same case categorical labels, you can just save the fixed up dataset with the actions automatically applied |
Usage side by side
Understanding your columns
Pandas profiling creates a local webserver so it is accessed in the browser as is Kortical. It gives you a huge and I mean HUGE list of columns to scroll through. This means a lot of legwork to find out what we need to do feature engineering on, what’s important and actually makes a difference to machine learning.
Interact with the image on the right to see how much scrolling is needed to see all the data columns on Pandas.

Pandas endless scrolling makes data anlysis feel like a never-ending chore.
You could use their correlations charts to try and spot which variables are highly correlated with SalePrice. If you look closely you can see that OverallQual seems darker than the other columns, though you might struggle to keep ranking the correlated variables by visual matching.
Kortical - ML Data prep on the other hand has a features importance chart and orders your variables by importance. This is able to find much more complex relationships than simple correlations. It also lets you know what columns can be safely dropped. There are many more insights it could have surfaced but these are the ones that are relevant for this dataset.
Diving into a Column
So if you’re looking through the columns one by one in Pandas Profiling you would have to figure out that OverallQual is important from this information. It does have a bunch of useful statistics but it can be hard to imagine their relationship to the target from this data alone.

In Kortical the important columns are surfaced to you in order of importance, so you can just start at the top and work your way down, knowing that the columns you’re looking at are very impactful. Kortical also shows you the relationship of column and the target, so you can understand why it’s predictive. Below you can easily see that the SalePrice goes higher as the OverallQaul score increases, showing a clear relationship.

You can also see the data distribution for the column.

Data Completeness
Pandas profiling has a number of charts but by far the most useful is the first called ‘Counts’. This shows which columns have a large proportion of missing values. It is not zoomable, so if you can’t make out the column name it becomes pretty useless but you can still get a sense of the overall shape and volume of missing data.

In Kortical the platform has a very similar chart but it is zoomable to be able to see any level of detail. It’s also colour coded, as completeness is not just about missing values but if a single value dominates too much. Green lets you know there is a good mix of values and pink tells you that a single value dominates the column. This can be ok but if you see a pink column that you would expect to have a good mix of values you should investigate. Kortical also offers a plaintext description of what’s going on and the check boxes allow you to select columns to remove but more on these later.

We can zoom in on problem columns and check columns we want to remove.

Target Insights
Pandas profiling doesn’t offer any target insights but Kortical has a good deal of useful info such as the problem type, possible evaluation metrics, ways to reframe the problem for better ML results and indicative Mean Absolute Error for different value ranges of SalePrice. Showing us that ML can slightly overestimate the value of the lowest range and underestimate in a big way the top range, while most middle ranges tend to be pretty accurate. This is not supposed to be the final model but to give an indication of performance.

Action Summary
Again this is unique to Kortical. What this section is about, is taking the various actions that Kortical suggests. For this dataset it is offering to remove the 12 columns that were surfaced through the insights as either not having enough data or having no bearing on the prediction. For other datasets it might be removing leaking variables or same casing categorical features, where the same label features multiple times, just with different capitalisation and many more potential transformations, surfaced by the insights. You can control which actions to take using the tick boxes near the insights and this section just lets you implement those actions automatically, leaving more time to focus on the more advanced machine learning features.
By offering automatic ways to remove redundant columns for machine learning, automatic leaking variable detection, it’s offering a way to cut down dataset sizes at the outset that simplifies and takes time and effort out of data exploration and training models. From here data can be saved or with the full platform you can create a model using our top ranked AutoML.

Try Kortical ML Data Prep for Free
With Kortical - ML Data Prep we’ve taken assisted data exploration and data preparation for machine learning to the next level but we’re only getting started, sign up for free today and let us know what you think of it.

Ready to automate real work?
Contact us to see a focused demo and explore the quickest path to production.
Thank you!
A Kortical team member will be in touch shortly